- TymeWear User Guide
- Startup Guides
- Garmin IQ Datafield
Garmin IQ Datafield
-
Supported Garmin Devices
- D2™ Air X10
- D2™ Mach 1
- Edge® 1030
- Edge® 1030 Plus
- Edge® 1030, Bontrager
- Edge® 1040
- Edge® 530
- Edge® 540
- Edge® 830
- Edge® 840
- Edge® Explore
- Edge® Explore 2
- Enduro™ 2
- epix™ (Gen 2), quatix® 7 – Sapphire Edition
- Forerunner® 245 Music
- Forerunner® 255
- Forerunner® 255 Music
- Forerunner® 265
- Forerunner® 265S
- Forerunner® 745
- Forerunner® 945
- Forerunner® 945 LTE
- Forerunner® 955, Forerunner® 955 Solar
- Forerunner® 965
- fēnix® 5 Plus
- fēnix® 5S Plus
- fēnix® 5X Plus
- fēnix® 6 Pro, fēnix® 6 Sapphire
- fēnix® 6 Pro Dual Power
- fēnix® 6 Pro Solar
- fēnix® 6S Pro, fēnix® 6S Sapphire
- fēnix® 6S Pro Dual Power
- fēnix® 6S Pro Solar
- fēnix® 6X Pro, fēnix® 6X Sapphire, fēnix® 6X Pro Solar, tactix® Delta Sapphire, quatix® 6X Solar, tactix® Delta Solar, tactix® Delta li Ballistics
- fēnix® 7, quatix® 7
- fēnix® 7S
- fēnix® 7X, quatix® 7X – Solar Edition
- MARQ™ (Gen 2)
- MARQ™ Adventurer
- MARQ™ Athlete
- MARQ™ Aviator
- MARQ™ Aviator (Gen 2)
- MARQ™ Captain, MARQ™ Captain: American Magic Edition
- MARQ™ Commander
- MARQ™ Driver
- MARQ™ Expedition
- MARQ™ Golfer
- Mercedes-Benz Venu® 2
- Mercedes-Benz Venu® 2S
- quatix® 6
- quatix® 6X, quatix® 6X Solar, quatix® 6X Dual Power
- tactix® 7, tactix® 7 – Pro Ballistics Edition, tactix® 7 – Pro Edition
- Venu® 2
- Venu® 2 Plus
- Venu® 2S
Installing the Tyme Wear Garmin data field
Important The Tyme Wear app needs to be active on your phone to stream the data to your Garmin device. We're working on streaming directly from the pod to Garmin but that's not available yet.
Step 1: Find the data field under “Tyme” on Garmin Connect IQ Store. You can access the store using the Garmin Connect Mobile app for Android or iOS.

Step 2: Click on the “Install” button and follow the instructions. You might see a pop-up message to grant access to data collection and Bluetooth. Select “Allow” when prompted.
IMPORTANT: Make sure your Garmin device is connected to the Garmin app. This will make the downloading process easier.

Accessing the Tyme Wear Data Field
Step 1: If the Data Field was installed and synced with your device successfully, you should be able to see the new Data Field on your Garmin App.

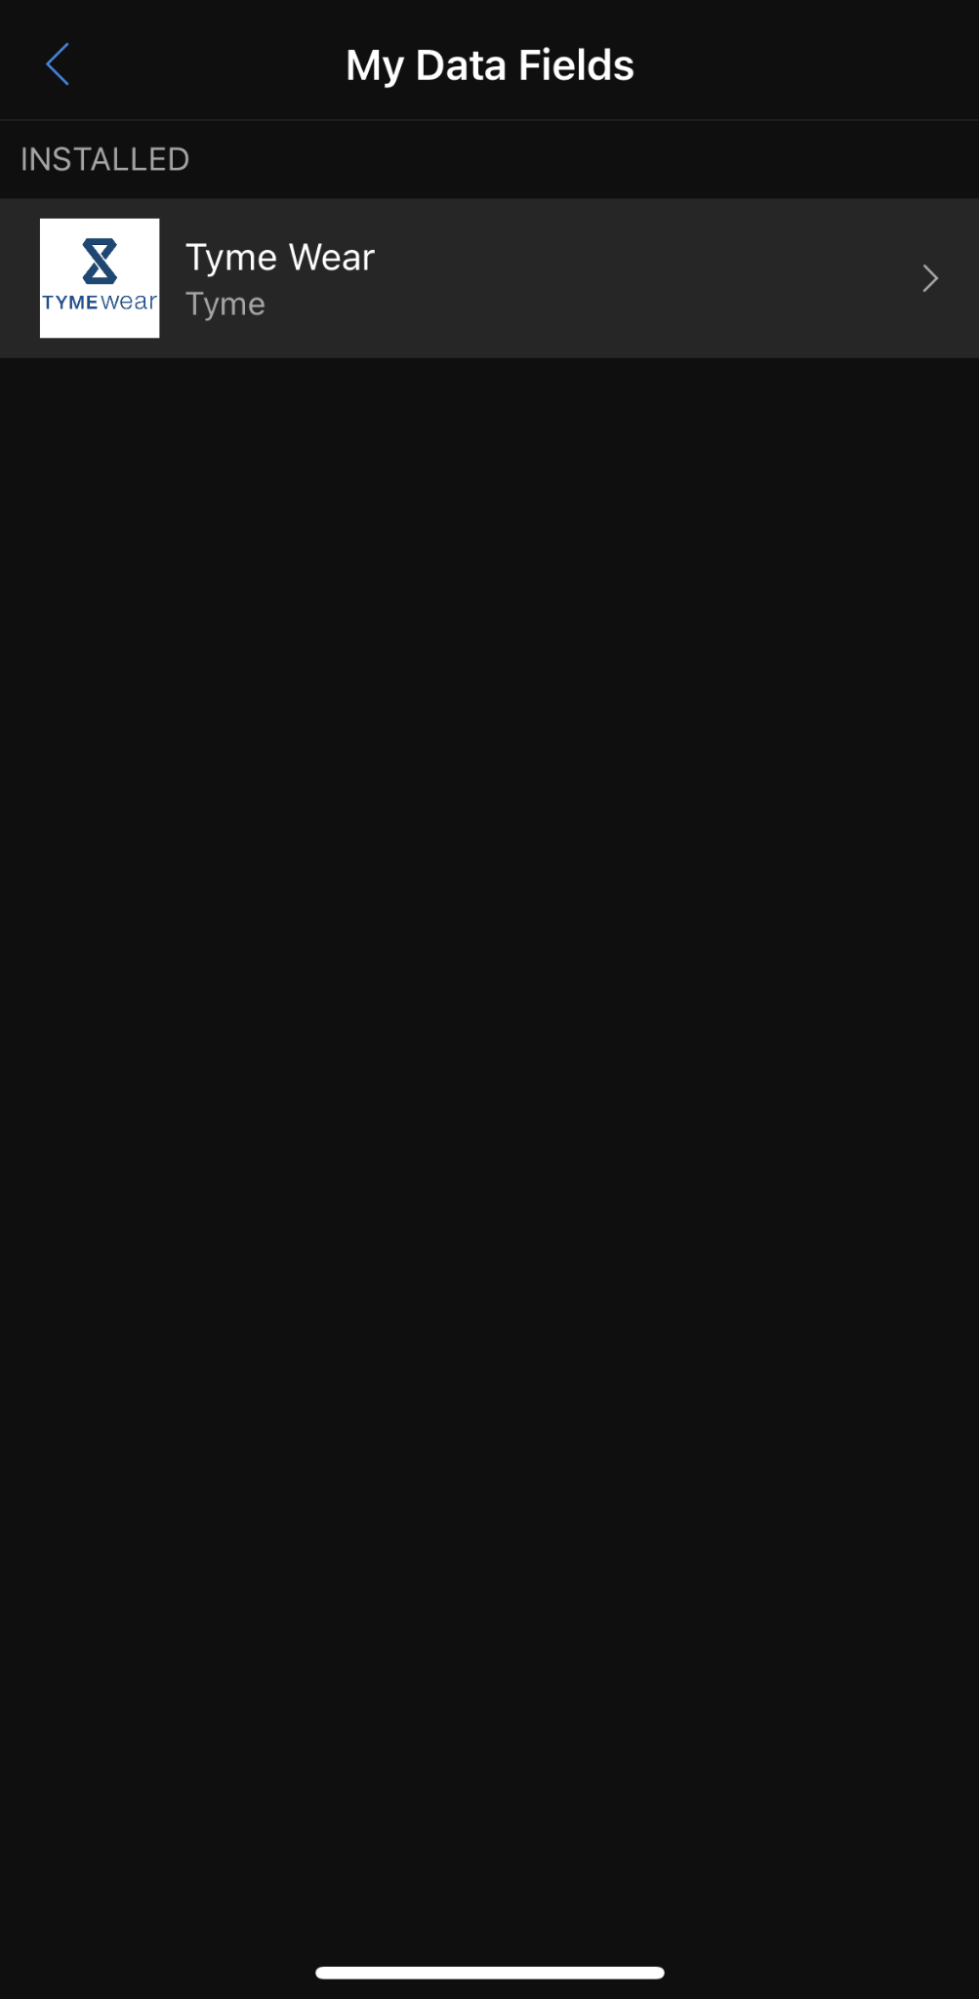
Step 2: Select the Data Field, and then click on the “Settings” button. To access the Tyme Wear Data Field configuration. Settings can be also modified later whenever it is needed.
Connect your Pod to the Tyme Wear Garmin Data Field
Step 1: Enter your POD ID into the field “POD ID to connect (0000 for any)”
You will find the POD ID on the back of your pod. It will look like this “TYME-XXXX”. Write the last 4 characters as the appear on your Pod into the space provided. For example, a POD ID might look like “TYME-1A2B”. In this case, you would right “1A2B”
Step 2: Make sure the toggle on the field “Connect to last Pod” is toggled OFF.
This ensures that the Garmin device will always try to connect to your unique Pod when it is available.

Define the external load metric for your data field
Step 1: Select the appropriate external metric for your sport select power or speed or pace.
Define your Ventilatory Threshold Targets
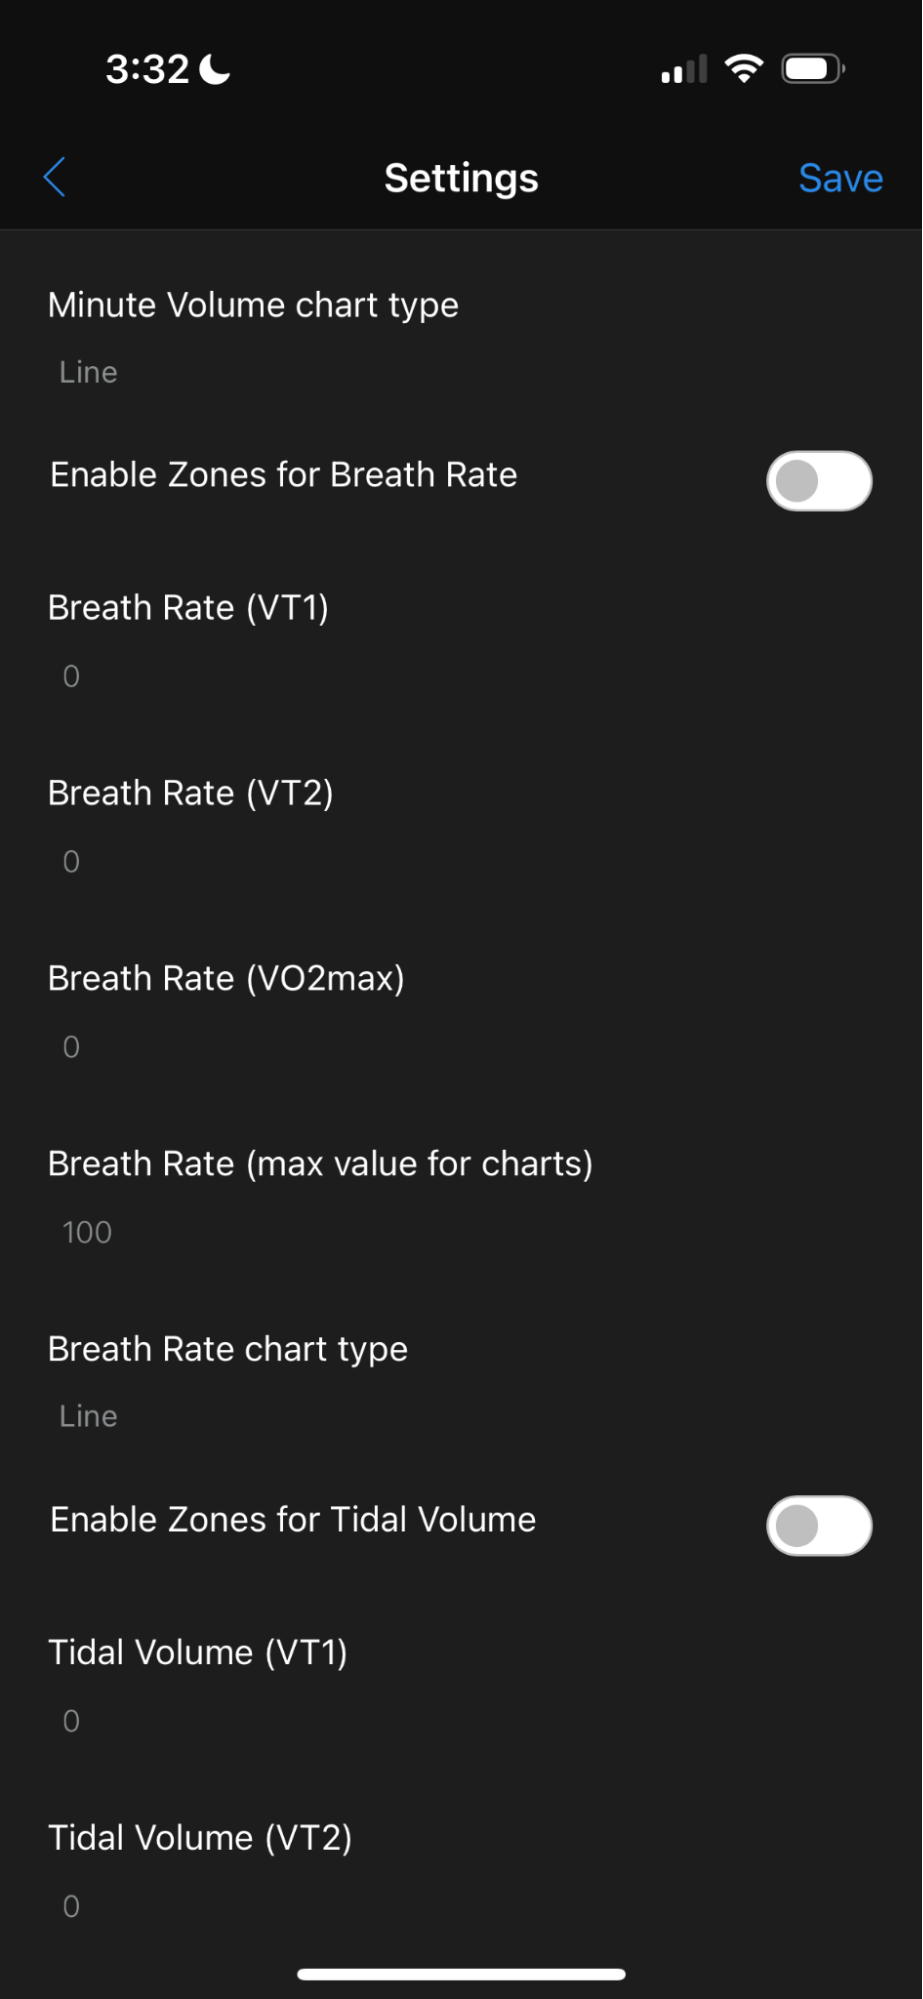
Step 1: Toggle “Enable Zones for Minute Volume”
Step 2: Input your known Minute Ventilation (VE) values into the respective fields for VT1, VT2, and VO2max. You can find these on your dashboard, or in the results of your threshold test
Step 4: Define the chart type by selecting between Line or Scatter in the “Minute volume chart type”
Step 3: The Tyme Wear Garmin Data Field allows you to set targets for a number of metrics, including Breathing Rate (BR), Tidal Volume (VT), Heart Rate (HR), Power, and Speed. If you’d like to visualize any of these targets, repeat Step 1, 2, 3 for each respective threshold target metric you would like to visualize.
IMPORTANT:
- If you do not yet have your threshold targets, then you must first do a Threshold Test in the Tyme Wear mobile app.
- In the case that Pace is selected as external load metric, the Data Field will convert speed values into pace (min/mi or min/km)
Enable your Pod’s battery indicator
Step 1: Enable/Disable the POD’s battery level display by toggling “Show battery level”

Select your default data plot
Step 1: Select the default plot to visualize in your datafield in the field “Metrics in chart”
IMPORTANT: This data plot will be the main plot displayed on the Tyme Wear Garmin data field.
Adjust the axis of your data plots
Step 1: Adjust the maximum value in the field “Minute Ventilation (max value for charts)”
Step 2: Repeat Step 1 for all other metrics, i.e. “Speed (max value for charts)” for speed/pace, etc.
Change your Data Field color theme
Step 1: Use color theme to choose light or dark colors according to device configuration or specifically for this data field.
IMPORTANT: We recommend starting with the initial values and adjusting them later if your data values are too high or low.
Installing the Data Field on the Garmin Device (Edge 1030)
- Follow the instructions provided by Garmin in the user manual of your device to set a data field into the screen layout. As an example, the process followed for Edge 1030 devices is shown below
- Power on your device. At the home screen, press and hold the profile you would like to install the data field to, to access its configuration. In this case we will be working with the “Indoor” profile.
- Select “Data Screens”
- Select “Add New”


- Select the “Data Screen” type on the next screen
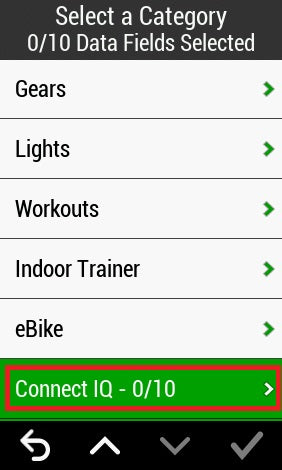
- Scroll all the way down to find the Connect IQ data fields and press on it
- If the installation of the Tyme Wear datafield on the Connect IQ app was successful, and the data was properly synchronized, you will be able to select the “TYMEwear” data Field. Make sure you select it and can see the tick mark in the box.
- Press the back button and you should be able to see the count increased on your Connect IQ data fields, as well as TYMEwear below it. Click the “Check” button to save the changes


- TYME Wear supports any screen layout. In case of single field layout current metrics values and different live plots are combined in the screen.
- For multi field layouts only current metrics values are shown. Some metrics are removed from the screen as the field size decreases
- Similar screens are used for watches
- IMPORTANT: A good practice is to set a specific single field screen for Tyme Wear, where live plots and all metrics information can be monitored and use additional multi field screens to combine simple Tyme Wear views with other data fields.


Activating the Data Streaming from the Tyme Wear Mobile app
IMPORTANT: The POD will not transmit breathing data even if it is connected to your Garmin device. Follow these instructions to enable data streaming.
Step 1: On the Tyme Wear mobile app, make sure the Pod is connected by pressing on the Pod icon, at the top right corner.
Step 2: Press on the Start button at the bottom of the screen and select the type of activity to be performed.
Step 3: Once the recording is started on the Tyme Wear mobile app, streaming will be enabled to your Garmin app.

Navigating the Tyme Wear Interface
See below the single field layout for Edge devices

At the top of the interface, on the left you will see the POD’s battery level. on the right, the POD ID that has been paired. If more PODs exist nearby, make sure it matches the POD being used. This will also indicate whether the POD is connected or not. If the pod is not connected, this field will show 3 dashes (---)
For touch screen devices, every metric is also a button. If you press on a metric, the plot will display the live data from that specific metric. If thresholds were defined in the configuration page of the Connect IQ Data Field, they will show here. When “Enable zones for …” is switched on in the Data Field settings, colors will display the corresponding training zones. Blue for zone 1, Orange for zone 2 and Red for zone 3.
For edge devices, pressing the Tyme Wear action button, will switch to a plot in which 3 metrics will be displayed at the same time according to following sequence:
- Minute Volume, Breathing Rate and Tidal Volume
- Minute Volume, Heart Rate and Power
- Breathing Rate, Heart Rate and Power
- Tidal Volume, Heart Rate and Power
Post workout analysis
TYME Wear data field saves Minute Volume, Breathing Rate and Tidal Volume into the fit file of the activity as developer fields (one record every 1 s) with following names:
- tyme_minute_volume
- tyme_breath_rate
- tyme_tidal_volume
Therefore, any 3rd party analysis software that can read developer fields can be used for post work analysis.
In addition, for simple and quick review, these metrics are available as charts within Garmin Connect platform
